AP-MS (Affinity Purification-Mass Spectrometry) proteomics analysis can uncover changes in the protein-protein interaction (PPI) network induced by drugs, validate the interaction between the protein of interest (POI) and E3 ligands, and accelerate the development of PROTAC targeted protein degraders.
Proteins are not isolated biological molecules, but rather complex structures with specific three-dimensional spatial arrangements that interact with other proteins to perform various functions. Among the numerous techniques for studying protein-protein interactions, AP-MS is the most classical. It allows for the construction of large-scale protein interactomes and enables differential analysis and temporal dynamics analysis of specific protein interactions under specific conditions.
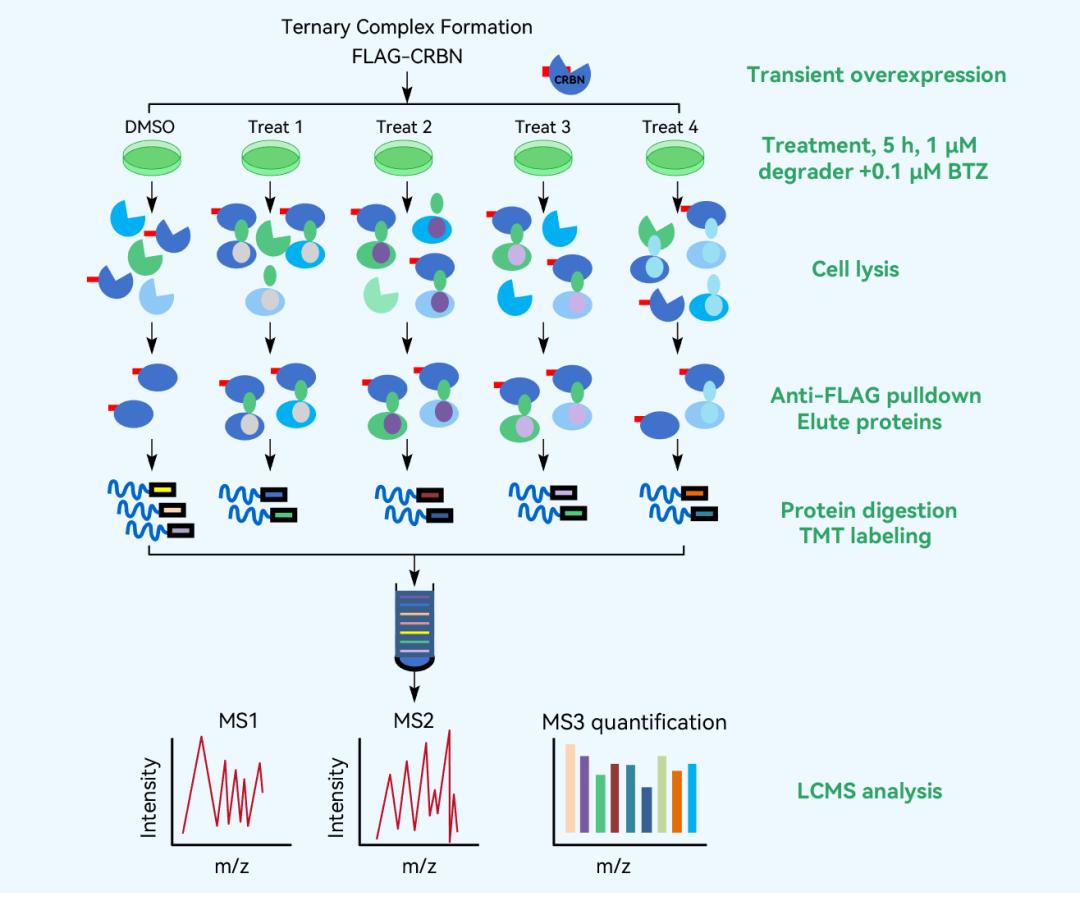
AP-MS Workflow
Service Advantages
Good reproducibility: The experimental system has low systematic errors and a low false-positive rate.
High throughput: Rapid and comprehensive analysis of all protein interactions.
High detection sensitivity: Detects protein abundance over a dynamic range of six orders of magnitude and can compare the relative abundance of each interacting protein.
AP-MS in PROTAC Drug Development
Changes in the protein-protein interaction (PPI) network of target proteins induced by the drug.
Verification of the interaction between the POI (protein of interest) and E3 ligand.
Classic Case
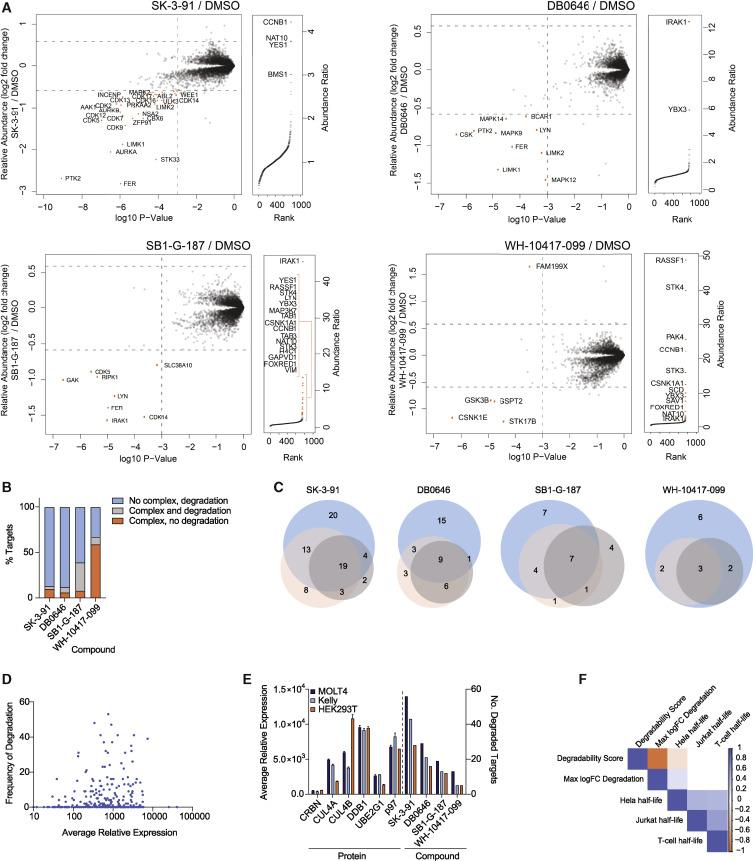
Verification of the relative abundance ratio of enriched proteins in FLAG-CRBN AP-MS experiments.
 AP-MS detection of enriched ternary complexes involving CRBN and degradation inducers.
Left: Scatter plot depicting the relative fold change (FC) of protein abundance after treatment in HEK293T cells. Right: Ranked plot showing the relative abundance ratio of proteins enriched in FLAG-CRBN stable transfectants in AP-MS experiments. B. Bar graph showing the proportion of proteins complexed and degraded as indicated compounds. C. Venn diagram displaying the unique and shared kinase hits identified for each compound in MOLT-4 (blue), KELLY (orange), and HEK293T (gray) cells. D. Comparison of degradation rates and relative protein abundance in MOLT-4 cells. E. Relative expression levels of proteins (left) and kinase degradation by the degradation inducers (right) in MOLT-4, KELLY, and HEK293T cells (n=2). F. Correlation between kinase degradation scores and reported protein half-lives.
Creative Proteomics PROTAC degradation proteomics services, which offer the following advantages:
Extensive non-target protein detection based on DIA and TMT, analyzing the degradation efficiency of target proteins and off-target effects after PROTAC treatment.
Targeted quantification detection using MRM/PRM technology to quantify the degradation levels of target proteins after PROTAC treatment, calculating DC50, DC90 values, or DCmax.
AP-MS proteomics technology for validating the interaction between target proteins and E3 ubiquitin ligases.
Ubiquitin proteomics technology to study the ubiquitination mechanism of target protein degradation after PROTAC treatment.
Simple/Digital Western, an enhanced version of traditional Western blotting, for accurate and reproducible protein quantification. It provides high detection efficiency and can evaluate target protein degradation, dose-response relationships, and calculate DC50 or DC90 values at the cellular level, organoid models, animal models, and other levels. It serves as a powerful tool for PROTAC development.
References
- Krönke J, Udeshi ND, Narla A, Grauman P, Hurst SN, McConkey M, Svinkina T, Heckl D, Comer E, Li X, Ciarlo C, Hartman E, Munshi N, Schenone M, Schreiber SL, Carr SA, Ebert BL. Lenalidomide causes selective degradation of IKZF1 and IKZF3 in multiple myeloma cells. Science. 2014 Jan 17;343(6168):301-5.
- Burslem GM, Crews CM. Small-Molecule Modulation of Protein Homeostasis. Chem Rev. 2017 Sep 13;117(17):11269-11301
Our products and services are for research use only.