The first step in any large proteomics project is usually a discovery proteomics analysis that gathers information on all proteins and protein forms in a biological sample. With little prior knowledge of the sample, thousands of proteins and protein forms can be identified in a single experiment.
Protein identification has been the basis of proteomics research for many years, but robust, reproducible and translatable methods for quantitative characterization of relative protein abundance are needed to obtain useful biological information.
The abundance of proteins in a target sample may vary over several orders of magnitude, and the concentrations of most target proteins are usually low. Discovery proteomics has extremely high requirements for separation, sensitivity and bioinformatics. Using Our advanced Discovery Proteomics and Target Proteomics Platform, Creative Proteomics offers quantitative proteomics services to identify low-abundance proteins in large numbers and proteins in complex sample matrices.
Our Protein Identification Service
Using a high-resolution, fast-sampling mass spectrometer operating in a data-independent mode (that is, collecting data in real-time), we can identify unknown proteins on a large scale from complex biological samples (such as cultures, tissues, or cells in plasma).
"Bottom-up" Method for Protein Identification
We first use trypsin to hydrolyze the protein, and then use the "bottom-up" proteomics to analyze the amino acid sequence of the protein of interest to identify the protein. This method uses liquid chromatography-mass spectrometry and can be applied to the identification of one or several proteins (from SDS-PAGE gel slices) or many proteins (100-1000s proteins) in whole cell lysates.
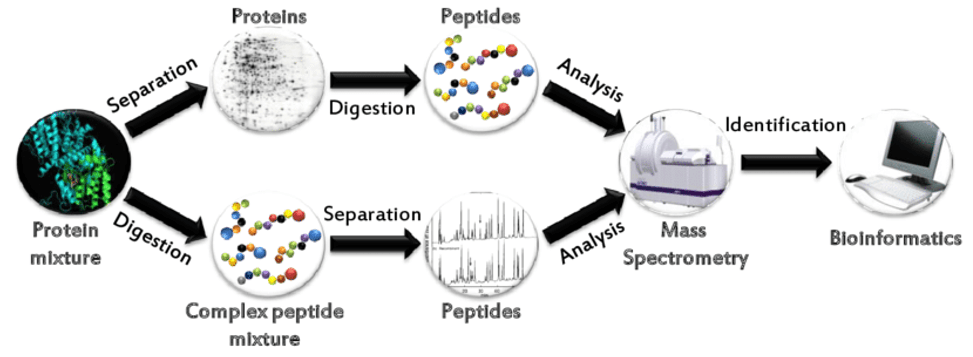 Common bottom-up approaches for protein identification by mass spectrometry
Our Protein Identification Services Include:
- Enzyme Digestion (Cell/Tissue Protein Extraction and Trypsin Digestion, SDS-PAGE and In-Gel Trypsin Digestion)
- Histone Extraction
- Plasma/Serum Protein Depletion
- Peptide Fractionation
- Peptide Purification and Concentration
- Quality Control Runs
- LC-MS/MS Analysis (DIA Mode)
- Database Search
Advantages:
- High accuracy
- High throughput, more than 9000 proteins can be identified at once
- Quantitatively identify nearly all detectable molecules, covering low-abundance proteins/peptides
- High repetition rate
- Complete and comprehensive sample information storage in the first analysis
Sample Requirements:
Based on our special protein extraction technology, we can quickly extract proteins from various samples and design personalized experimental schemes according to different experimental purposes. Specific requirements are as follows:
| Sample Type |
Protein |
# of Cells |
Animal Tissue |
Plant Tissue |
Blood |
Urine |
Serum |
Microbes |
| Quantify |
100 ug |
1×10⁷ cells |
1 g |
200 mg |
1 mL |
2 mL |
0.2-0.5 mL |
Dry weighed: 200 mg |
Note:
- Please prepare enough dry ice or ice packs to ensure low temperature during sample transportation.
- Our service is for research use only and is not intended for diagnosis.
Delivery:
LC-MS/MS Report
Reference:
- Ricardo J. Carreira. Development of new methodologies in sample treatment for proteomics workflow based on enzymatic probe sonication technology and mass spectrometry.
Case Enhancing Identification and Accuracy through Narrow Precursor Mass Range DIA
Background
Mass spectrometry (MS)-based proteomics has emerged as a pivotal tool for studying complex biological systems. This study aims to improve upon conventional Data-Independent Acquisition (DIA) methods by exploring the impact of precursor mass range on protein identification and quantification accuracy.
Samples
Arabidopsis root cell suspension cultures were used as the experimental samples. Cells isolated from Arabidopsis roots were subjected to growth conditions and harvested for subsequent proteomic analysis.
Technical Methods
Data-Independent Acquisition (DIA): DIA is a mass spectrometry-based proteomic technique that cyclically fragments all peptides across the entire precursor mass range. Unlike Data-Dependent Acquisition (DDA), which selects specific peptides for fragmentation based on intensity, DIA systematically covers the entire mass range, providing a comprehensive view of the proteome.
Precursor Mass Range Evaluation: To assess the impact of precursor mass range on protein identification and quantification accuracy, the study systematically analyzed DIA data with various precursor mass ranges, ranging from 150 to 800 m/z units. The evaluation aimed to identify the optimal precursor mass range that maximizes identification while maintaining high quantification accuracy.
Gas-Phase Fractionation (GPF): To further enhance DIA analyses, the study employed a gas-phase fractionation (GPF) strategy. GPF involves dividing the conventional precursor mass range (400–1200 m/z) into narrower segments: 400–650, 650–900, and 900–1200 m/z. This division was intended to focus on specific mass ranges, potentially improving identification and quantification of proteins within those segments.
Spectronaut Software for Data Analysis: Spectronaut Pulsar software was utilized for DIA data analysis. The software combines DIA–MS data files with a previously generated Arabidopsis spectral library. The library comprises a combination of a TAIR11 proteome sequence and sequences from six spike-in proteins. Key parameters for database match and library generation include trypsin digestion specificity, peptide length constraints, missed cleavage allowances, and modifications such as carbamidomethylation and methionine oxidation.
Library Generation: The study generated a spectral library by combining DIA–MS data files with the previously constructed Arabidopsis library. The library included information on precursor masses, fragment ions, and retention times. A false discovery rate (FDR) of 0.01 was set for peptide-spectrum match (PSM), peptide, and protein identification to ensure high confidence.
Quantitation Analysis: Two approaches were employed for quantitation analysis - library-based matching and directDIA. In library-based matching, the newly generated spectral library was used for spectral matching, while directDIA involved generating pseudo-MS2 spectra directly from DIA data. Parameters for data extraction included maximum intensity in both MS1 and MS2 spectra, with relative mass tolerances of 10 and 20 ppm, respectively.
Quantitative Accuracy Assessment: Quantitative accuracy was assessed through the calculation of median coefficients of variation (CV) for protein group quantities. The study compared the performance of DIA with narrow precursor mass range (250 m/z units) against conventional DIA (cDIA).
Common Identifications and Spike-In Experiments: Common identifications were extracted and compared between narrow precursor range DIA and conventional DIA. To demonstrate the robustness of identifying differential expression, spike-in experiments were conducted by introducing a set of six proteins in varying amounts into the Arabidopsis samples. The accurate quantification of these spiked-in proteins served as an indicator of the method's reliability in complex sample analysis.
Statistical Analysis: Statistical analysis involved unpaired t-tests with assumptions of equal variance, group-wise testing correction, and clustering. Proteins with a fold-change higher than 1.5 and a q-value less than 0.001 were considered differentially expressed.
Results Visualization: Results were visualized through histograms, scatter plots, and other graphical representations, providing insights into the distribution of identified proteins, their abundances, and the correlation between different quantitation approaches.
Results
Identification and Quantification Accuracy: The narrow precursor mass range DIA demonstrated a 34.7% increase in the number of identified protein groups, with a 54.7% improvement when combining three independent DIA analyses using GPF. Median coefficients of variation (CV) indicated quantification accuracy exceeding that of conventional DIA.
Comparison with Conventional DIA: A direct comparison between narrow precursor range DIA and conventional DIA revealed a correlation coefficient >0.9, affirming overall similarity in quantitation. However, the narrow precursor range DIA method excelled in accurately quantifying proteins with a high dynamic range.
Robustness in Identifying Differential Expression: The study showcased the robustness of the narrow precursor range DIA method in identifying differential expression within a complex sample, emphasizing its accuracy in real biological scenarios.
Spectral Library Impact: Narrow precursor mass range DIA enhanced spectral resolution and specificity, contributing to higher-confidence identifications. The use of a sample-specific library further improved protein identification.
Practical Implications: The workflow, while sophisticated in its methodology, remains practical and offers significant advantages, particularly in the accurate quantification of low-abundance proteins and the exploration of signaling mechanisms in complex biological studies.
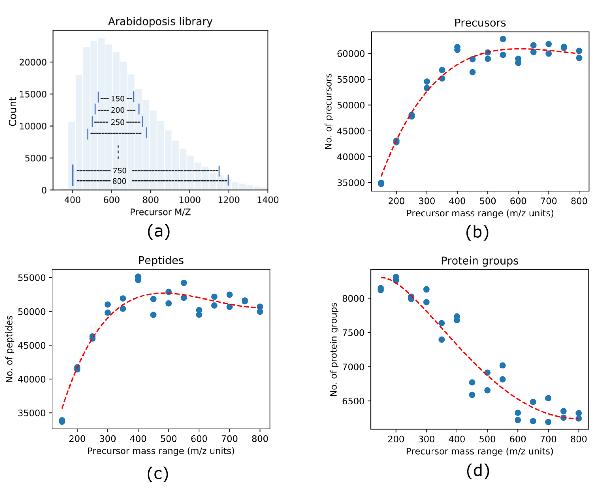 Size of precursor mass range affects DIA identification.
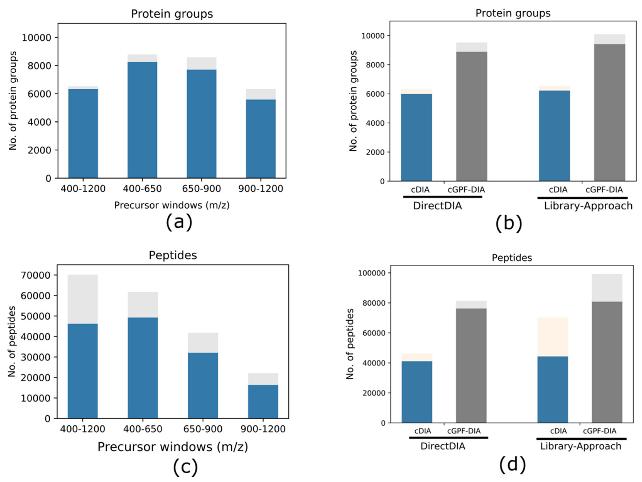 Protein groups and peptides identified from different approaches with each condition run in triplicate.
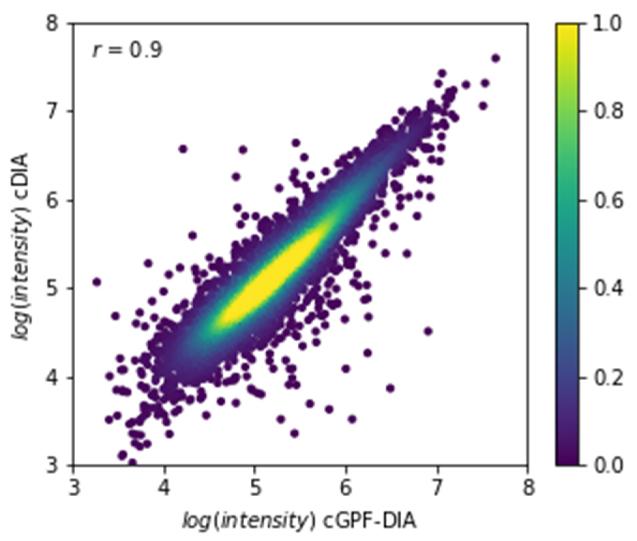 Correlation of quantitative intensities of common identifications (n = 6306) between cDIA and cGPF-DIA.
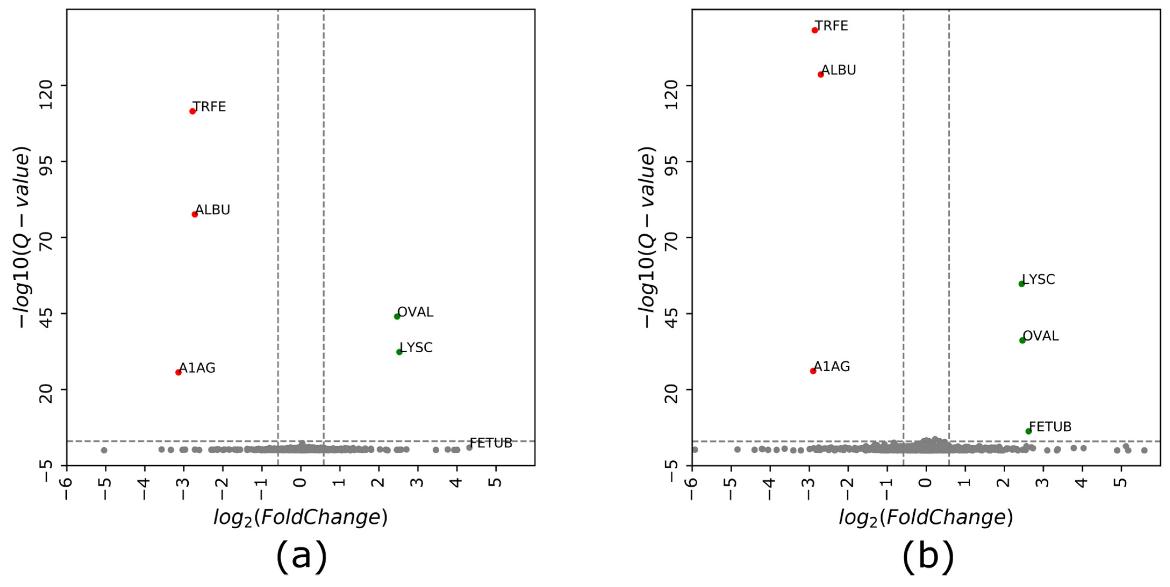 Volcano plot of protein intensity ratios log2 (samples 2/1) obtained using (a) cDIA and (b) cGPF-DIA approaches.
Reference:
- Zhang, Huoming, and Dalila Bensaddek. "Narrow Precursor Mass Range for DIA–MS Enhances Protein Identification and Quantification in Arabidopsis." Life 11.9 (2021): 982.

 Common bottom-up approaches for protein identification by mass spectrometry
 Size of precursor mass range affects DIA identification.
 Protein groups and peptides identified from different approaches with each condition run in triplicate.
 Correlation of quantitative intensities of common identifications (n = 6306) between cDIA and cGPF-DIA.
 Volcano plot of protein intensity ratios log2 (samples 2/1) obtained using (a) cDIA and (b) cGPF-DIA approaches.
 4D Proteomics with Data-Independent Acquisition (DIA)