4D Protein Post-translational Modifications (PTMs) Proteomics Service
Common Protein Post-translational Modifications
Protein phosphorylation is one of the most important covalent modifications in living organisms and is by far the most distributed and widely studied modification, which occurs by transferring the phosphate group of ATP to the amino acid (Ser, Tyr, Thr) side chain of a protein, catalyzed by kinase.
In the process of protein acetylation, under the catalysis of acetyltransferase, acetyl groups (such as acetyl-CoA and other donors) are covalently bound to the lysine residues of the substrate protein. This modification mainly occurs in the ε-NH2 position of protein lysine residues, which will increase the molecular weight by 42.01Da. Mass spectrometry can accurately determine whether the molecular weight has a corresponding mass shift, realizing the analysis of acylated modified peptides and sites.
Protein ubiquitination occurs through a three-enzyme cascade (E1-E2-E3) reaction that allows single or multiple ubiquitin molecules to be attached to protein amino acid (Lys) side chains, and is often accompanied by proteasomal degradation that regulates changes in protein expression levels. The modified lysine is covalently linked to the ubiquitin molecule, that is, two glycine K-ε-GG residues, resulting in a mass shift of 114.1Da in molecular weight. Mass spectrometry can be used to accurately determine whether the molecular weight has a mass shift of 114.1 Da, so as to detect ubiquitinated modified peptides and sites.
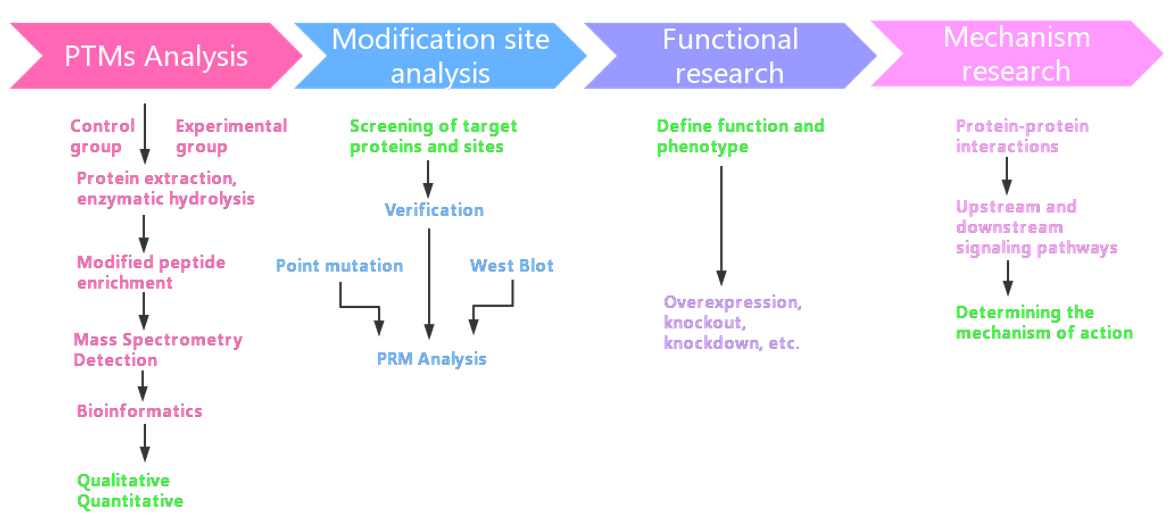
Experimental Ideas for PTMs Proteomics

Our 4D PTMs Services:
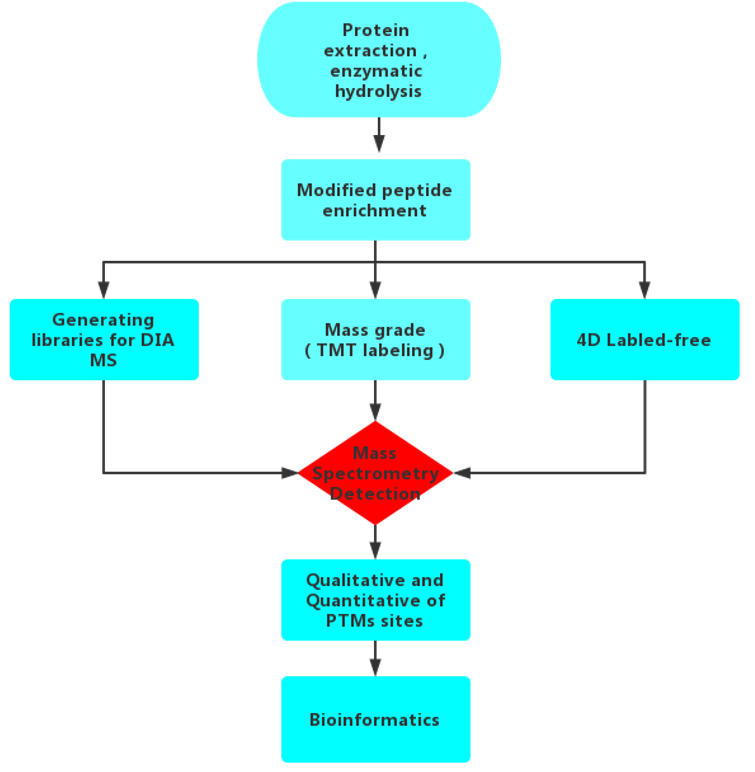
We use 4D proteomics technology to provide you with protein post-translational modification services.
The new generation of timsTOFPro mass spectrometer is used to provide 4D label-free PTMs services, which can effectively differentiate modified isomeric peptides for differential modified proteomics analysis. It greatly improves the depth of modification identification and achieves a comprehensive improvement of proteomics in terms of coverage depth, sensitivity and throughput with less loading volume and faster scanning speed.
Workflow:

Data Analysis
| Standard Data Analysis Content |
| Mass spectrometry data analysis | Spectral peptide quality deviation distribution, peptide length distribution, unique peptide number distribution, protein coverage distribution |
| Protein Expression Analysis | Protein abundance value distribution of PTMs, protein abundance ratio distribution of PTMs between samples, PCA analysis, statistical analysis of significant differences |
| Protein Functional Analysis | Total protein and differential protein GO secondary classification, COG function classification, KEGG annotation, subcellular organelle location, domain annotation, signal peptide prediction and PPI prediction; differential protein GO, KEGG, domain enrichment analysis |
| Advanced Data Analysis Content |
| Protein Gene Chromosome Localization | Obtain the distribution of genes encoding proteins on chromosomes |
| WGCNA Analysis | Predict functional clustering and network interactions by protein expression level; correlate with phenotype data to obtain key proteins or protein complexes that influence phenotype |
| Trend Cluster Analysis | Obtain protein expression trend patterns |
| Molecular Typing | Molecular typing for large cohort samples |
| Survival Curve Analysis | Study the relationship between influencing factors and survival time and outcome |
| ROC Curves | Evaluate predictive accuracy by combining specificity and sensitivity, such as biomarker impact assessment on tumor grade |
Applications:
4D phosphoproteomics
- Cell communication, growth and proliferation, cell cycle regulation.
- Carcinogenesis and metastasis, neurotransmission.
- Physiological studies of plant and microbial growth, development, stress and adversity.
- High-throughput analysis on drug targets of action.
4D acetylation proteomics
- Metabolic regulation: metabolic diseases and disorders, etc.
- Modified protein expression analysis of pharmacological drug targets and gene knockdown/overexpression.
- Physiological studies of plant and microbial growth and development.
- Signaling pathways such as cell autophagy and cell cycle.
- Protein mechanism of action and specific functional protein screening.
4D ubiquitin proteomics
- Modified protein expression analysis of pharmacological drug targets and gene knockout/overexpression.
- Physiological studies of plant and microbial growth, development, stress and adversity.
- Signaling pathways such as cell autophagy and cell cycle, and senescence.
- High-throughput analysis of disease biomarkers and drug targets of action.
- Mechanistic studies of neurological degenerative diseases, tumor pathogenesis, etc.
- Protein action mechanism and special function protein screening.
4D methylation proteomics
- Chromatin structure as well as transcriptional regulation.
- Maintenance of protein stability, regulation of protein transcription, binding activity, DNA replication, and damages.
- Closely related to diseases such as cancer, aging, Alzheimer's disease, and epigenetics research content.
Sample Requirements:
- Co-IP Samples: Protein requirement is around 2-5ug.
- Tissue Samples:
| Tissue Samples | Protein | # of Cells | Animal Tissue | Plant Tissue | Blood | Urine | Serum | Microbes |
| Quantify | 100 ug | 1×10⁷ cells | >200 mg | 1 g | 1 mL | 2 mL | 0.2-0.5 mL | Dry weighed: 200 mg |
- Protein Samples: Please make sure the total amount of protein is above 50ug; ordinary tissue and cell lysate can be used for protein extraction.
- Transportation: Please use sufficient amount of dry ice for transportation and try to use a fast postal delivery method to reduce the possibility of sample degradation during transportation.
Report:
- Experimental steps
- Relevant experimental parameters
- Mass spectrometry spectra
- Raw data
- Proteomics analysis results
In addition, we also provide 4D Label-Free Proteomics and 4D-DIA Quantitative Proteomics. Please contact us for more details.
* For Research Use Only. Not for use in the treatment or diagnosis of disease.


 4D Proteomics with Data-Independent Acquisition (DIA)