- Service Details
- Demo
- Case Study
- FAQ
- Publications
As one of the core contents of the "post-genome" era, proteomics directly and comprehensively analyzes the protein abundance or PTMs level of samples, and comprehends regulatory mechanisms such as protein function and interaction relationship that cannot be determined by genomics and transcriptomics. Importantly, proteins are direct products of genes; one gene sequence may produce two or more protein products. Even under different conditions or at different period, the cellular proteome may be completely different. Therefore, proteomics research is of great value for pathology, toxicology and pharmacokinetics investigation. The advancement of proteomics technologies has significantly enhanced the opportunities for identifying diagnostic markers of diseases and screening potential drug targets.
What is Proteomics?
The field of proteomics involves a comprehensive and systematic investigation into the complete repertoire of proteins expressed by organisms or cells, encompassing information on protein expression abundances, variations and degradation, post-translational modifications (PTMs), as well as their interacting partners and networks. By conducting qualitative, quantitative, molecular function analysis, pathway analysis and protein interaction analysis of the proteome, proteomics can better reveal biological functions, mechanisms, prediction of upstream and downstream changes in proteins and disease markers for diagnosis. Besides, proteomics can overcome the uncertainty of nucleic acid level prediction and reflect translation results. Importantly, MS-based proteomics has undergone rapid development and significant maturation over the past few decades that collectively contribute greatly to our understanding of protein functions and biological systems.
Proteomics Service in Creative Proteomics
The Main Contents of Proteomics Research
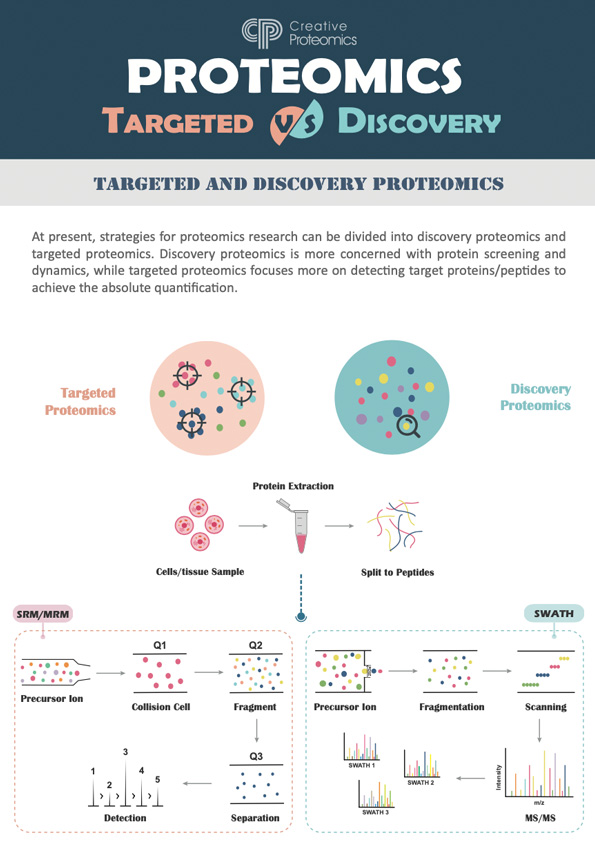
1) Discovery Proteomics
Discovery proteomics aims to identify and catalog all proteins present in a biological sample under specific conditions. This area provides an initial broad overview of the proteome and helps uncover previously uncharacterized proteins and their post-translational modifications (PTMs). Mass spectrometry is the primary technique used for protein identification and quantification.
2) Targeted Proteomics
Targeted proteomics focuses on the quantification of specific proteins of interest within complex samples. Using techniques like Multiple Reaction Monitoring (MRM) and Parallel Reaction Monitoring (PRM), this approach provides high sensitivity and precision for measuring proteins involved in particular pathways or diseases.
3) Differential Proteomics
Differential proteomics compares protein expression levels between different conditions (e.g., disease vs. healthy). This approach identifies proteins whose abundance changes in response to specific stimuli or treatments, providing insights into disease mechanisms and potential biomarkers.
4) Functional Proteomics
Functional proteomics focuses on understanding the roles of proteins in cellular processes. It explores how proteins contribute to biological functions such as signaling, metabolism, and gene regulation. This area also involves studying protein complexes and their interactions within cellular pathways.
5) Structural Proteomics
Structural proteomics studies the three-dimensional structures of proteins and their complexes to understand their functions. Techniques such as X-ray crystallography, NMR, cryo-EM, and computational modeling are used to map protein folding, interactions, and structural conformations.
6) Spatial Proteomics
Spatial proteomics investigates the localization of proteins within cells, tissues, or organs. By understanding where proteins are located in the cell, researchers can gain insights into their functional roles and how mislocalization may lead to diseases. Techniques like fluorescence microscopy and MALDI imaging are often employed.
Nowadays, proteomics research is widely applied in many scientific fields, such as:
1) Diabetes research;
3) Diagnostic biomarker discovery;
5) Microbiology;
7) Toxicological testing;
9) Antibody profiling for study and treatment disease.
2) Cancer research;
4) Plant and animal phenotyping;
6) Drug discovery and development;
8) Structural biology;
Analytics Platform for Proteomics Services
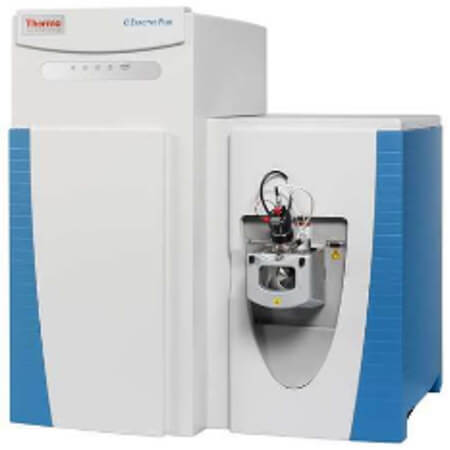
Thermo Q ExactiveTM series
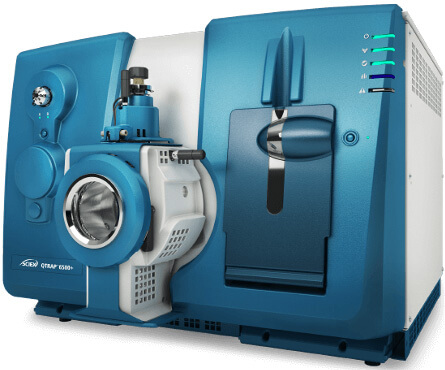
AB Sciex 6500+
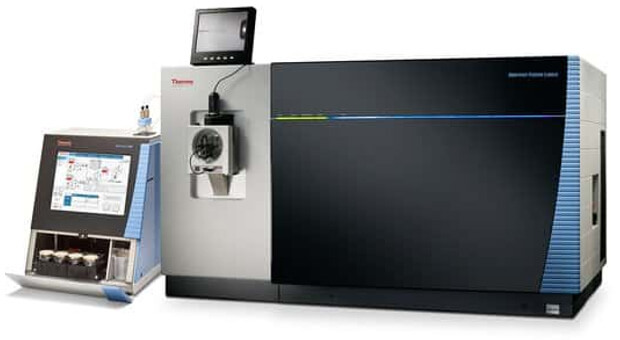
Thermo Orbitrap Fusion Lumos
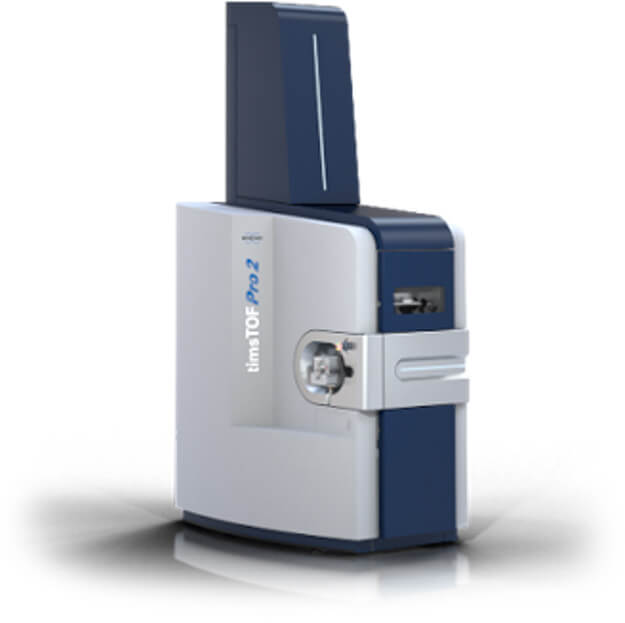
Bruker timsTOF Pro
Workflow of Our Proteomics Services
In Creative Proteomics, we will professionally design for your project as figure 1. The classical process is: 1) Project design; 2) Protein fractionation; 3) Peptide fractionation; 4) Mass spectrometry; 5) Data identification and analysis; 6) Quantification.
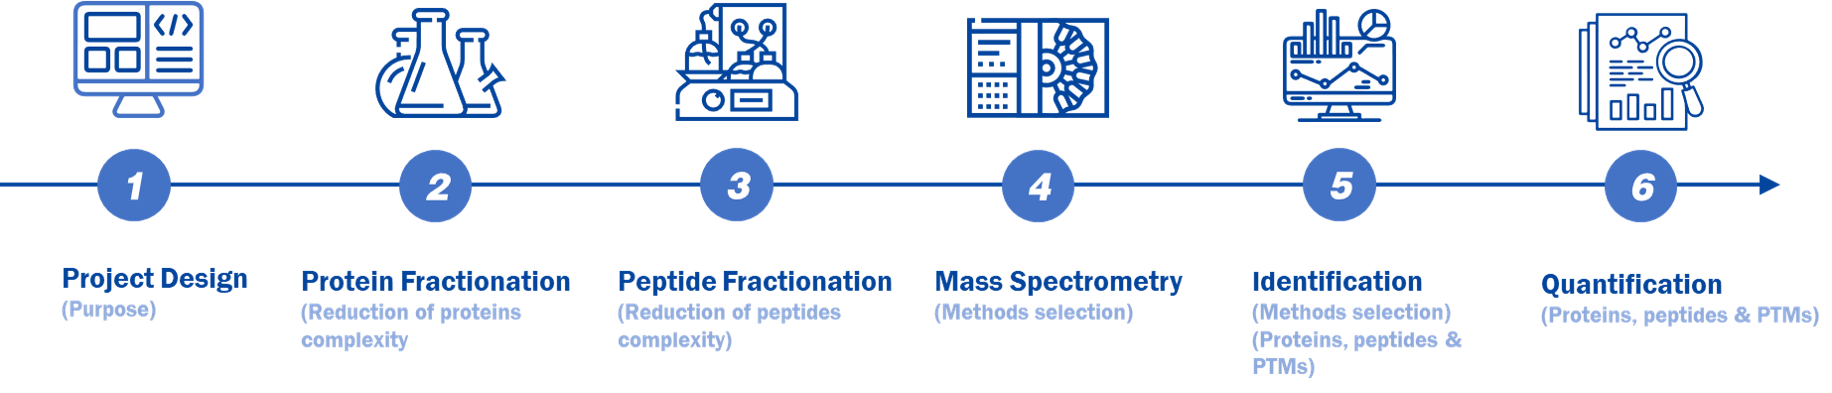 Figure 1. A typical MS-based proteomic workflow.
| Experimental Procedure | Technical Methods |
|---|---|
| Project Design (Purpose) | Untargeted proteomics Targeted proteomics PTMs proteomics |
| Protein Fractionation (Reduction of proteins complexity | 1D or 2D gel electrophoresis |
| Peptide Fractionation (Reduction of peptides complexity) | Reversed phase High Performance Liquid Chromatography (RP-HPLC) |
| Mass Spectrometry (Methods selection) | lon Source
Mass Analyzer
lon Activation
MS scanning modes
|
| ldentification (Methods selection) (Proteins, peptides & PTMs) | Database searching
|
| Quantification (Proteins, peptides & PTMs) | Label
Absolute quantification (AQUA, Qcon CAT) |
The high-throughput proteomics approaches employed by Creative Proteomics are powerful tools that facilitate the identification and quantification of thousands, or even millions, of proteins from a single analysis for large-scale protein profiling. Importantly, equipped with a highly experienced technical team and a senior bioinformatics data processing team, we possess the capability to handle diverse sample types and provide comprehensive investigations, encompassing whole proteome profiling, subcellular proteomics analysis, PTMs characterization, protein-protein interaction assessment, and monitoring of protein turnover dynamics. We are also professional in small protein (length<100), or peptidomics investigation.
Brochures
Proteomics Services
Welcome to the uncharted territory of proteomics, a revolutionary journey led by Creative Proteomics. Our latest brochure is your gateway to understanding the significance and potential of proteomics and how Creative Proteomics is poised to provide you with exceptional proteomics solutions.
Technologies Superiority
- Professional detection and analysis capability: Experienced research team, strict and matured techniques.
- Breadth: we could skillfully deal with protein samples derived from a wide range of sources, encompassing animal and plant tissues, bacteria, blood, membrane proteins, nuclear proteins, secreted proteins, etc.
- High stability and reproducible: Obtain consistent and reproducible inter- and intra- assay results for data analysis.
- High specificity and accuracy: Skillful quantification proteomics techniques, and PTMs enrichment methods.
- High resolution and sensitivity: Triple TOF 5600, Q-Exactive, Q-Exactive HF, Orbitrap Fusion™ Tribrid.
How to place an order
At Creative Proteomics, experienced proteomics research team, strict quality control system, together with ultra-high resolution detection system and professional data pre-processing and analysis capability, ensure reliable and accurate data. Please feel free to contact us by email to discuss your specific needs. Our customer service representatives are available 24 hours a day, from Monday to Sunday.


Bar Chart of Total Protein Identification

2D PCA Plot of Sample Grouping

3D PCA Plot of Sample Grouping

Pearson Correlation Analysis

Sample Hierarchical Clustering

Volcano Plot of Differential Proteins

Bar Chart of GO Enrichment for Candidate Proteins

KEGG Pathway Enrichment of Candidate Proteins
Quantitative Proteomic Analysis of Cellular Responses to a Designed Amino Acid Feed in a Monoclonal Antibody Producing Chinese Hamster Ovary Cell Line
Journal: Iranian Biomedical Journal
Published: 2018
Background
Chinese hamster ovary (CHO) cells are widely used in biopharmaceutical production due to their ability to produce human-like proteins and adapt to serum-free media, which simplifies processing and reduces variability. Enhancements in CHO cell productivity have mainly been achieved through process optimization techniques, such as refining media and feeding strategies. Genetic and cell engineering approaches have also been explored but have shown limited success compared to process improvements.
A thorough understanding of CHO cell machinery is essential for further productivity gains. Systems biology tools, including transcriptomics, proteomics, and metabolomics, have been used to study CHO cell physiology and productivity. This study utilizes label-free quantitative proteomics to analyze the impact of a designed amino acid feed on protein expression and productivity in CHO cells, specifically focusing on monoclonal antibody production. This is the first proteomic study to examine how feed formulation affects biological processes during mAb production in CHO cells.
Materials & Methods
Cell Line and Culture Media:
Recombinant CHO cells producing Bevasizumab were obtained from Aryogen Pharmed. Cells were cultured in CDM4CHO medium with 6 mM L-glutamine in 500-ml shaker flasks at 37 °C with 5% CO2 and 80 rpm. The temperature was shifted to 32 °C during the logarithmic phase, with an initial cell density of 5 × 10^5 cells/ml.
Feeds and Components:
Two feeds were used: a designed amino acid feed (Feed A) with 75 mM aspartic acid, 15 mM glutamic acid, 2.5 mM glycine, and 12.5 mM arginine, and a control feed (Feed B). Feed A was added on days 3, 5, and 7.
Proteomic Analysis:
Three biological replicates per feed were analyzed using label-free quantitative proteomics. Cells were harvested on day 10, lysed, and digested. Peptides were analyzed by nanoLC-MS/MS using an Easy-nLC1000 system and LTQ-Orbitrap Elite mass spectrometer. Data were processed with Mascot in Proteome Discoverer, and proteins with at least two unique peptides were quantified. Differentially accumulated proteins were identified with fold-change ≥1.5 and p ≤ 0.05.
Bioinformatic Analysis:
Proteins were annotated and analyzed for GO pathway enrichment using Blast2GO, with significance set at p ≤ 0.05.
Western Blot Analysis:
Proteins (35 µg) were separated by 12% SDS-PAGE, transferred to nitrocellulose membranes, and blocked. Membranes were incubated with primary and secondary antibodies, then developed with ECL plus kit and visualized using Kodak Image Station 4000MM Pro.
Results
Protein Expression and Productivity:
Label-free quantitative proteomic analysis was performed on CHO cells cultured with either feed A or control feed, with samples collected on day 10. Feed A resulted in a 70% increase in monoclonal antibody (mAb) titer compared to the control feed. Additionally, viable cell density and cell viability were improved in the feed A group (Fig. 1A-C).
 Fig. 1 The final mAb titer (A), the viable cell density (B), and the viability percentage (C) in feed A group vs. control group.
Differential Protein Expression:
A total of 41 proteins were differentially expressed in cells fed with feed A compared to the control. Of these, 30 proteins were up-regulated and 11 were down-regulated.
Biological Process Up-regulation:
Key biological processes up-regulated in the feed A group included the pentose-phosphate shunt, glutathione (GSH) metabolism, negative regulation of apoptosis, response to oxidative stress, intracellular transport, and proteasomal protein catabolism. Down-regulated processes were not significant.
Western Blot Confirmation:
Western blot analysis validated the up-regulation of G6PDH, GSS, and PSMB, which are involved in the pentose phosphate shunt, GSH metabolism, and proteasomal protein catabolism, respectively (Fig. 2).
 Fig. 2 Western blot images of beta-actin, G6PDH, GSS, and PSMB of control group and designed amino acid feed group (feed A). Beta-actin was used as a control protein.
How many biological replicates are generally recommended for proteomics?
In principle, the more biological replicates, the better, as this helps eliminate individual differences and results in more accurate identification of differential proteins, thereby increasing the success rate of validation. Considering budget constraints, statistical analysis requirements, and potential scrutiny from editors, it is recommended to have at least ten replicates per group for clinical samples, and at least three replicates per group for samples from other sources.
Which proteomics technique should I choose for my research?
TMT Labeling Technology: If your sample size is less than 18, TMT technology, which allows the simultaneous detection of up to 18 samples with good parallelism and accuracy, is recommended.
DIA Technology: If the sample size exceeds 16, DIA is more stable and reproducible, so it is recommended.
TMT vs. DIA: TMT can only detect proteins common to all samples and is not suitable for highly variable samples (e.g., different species or tissues). DIA, being label-free, can detect unique proteins in samples and is better for highly variable samples or when unique proteins are of interest.
Budget Constraints: If budget is a concern, Label-free technology can be chosen.
How should proteomics samples be shipped?
Standard biological samples such as tissues, cells, and fluids should be stored at low temperatures and shipped with dry ice. Gel strip samples can be shipped with ice packs.
Can proteomics detect unknown proteins or exogenous proteins not present in the sample species' database?
Proteomics results are compared against known protein databases, so unknown proteins cannot be predicted. If you need to detect unknown proteins, sequencing or other methods should be used. If the protein of interest is not in the database, it cannot be detected. However, the protein sequence can be added to the database as a search file for analysis.
Why are fewer proteins detected?
This could be due to a small database, leading to fewer detected results. You may expand the database or select a related, well-studied species or model organism database for analysis. Additionally, check the gel images to see if there are few bands in the sample itself or if high-abundance proteins are present, as high-abundance proteins can affect the detection quantity.
Why is there a significant difference between the molecular weight of identified proteins and those estimated from the gel electrophoresis?
Due to in vivo or in vitro factors, the same protein may undergo different modifications, cleavage, or degradation, resulting in protein bands of varying molecular weights seen on the gel electrophoresis. However, during mass spectrometry identification, these proteins point to the same theoretical, full-length, unmodified protein sequence in the database. Hence, the molecular weight seen in the gel (actual molecular weight) may differ from the identified protein's theoretical molecular weight.
How are differential proteins selected?
The criteria for selecting differential proteins mainly combine the p-value from a T-test and the FC (fold change) value. Generally, for labeled products, the criteria are FC > 1.2 or FC < 0.83, p < 0.05; for unlabeled products, FC > 1.5 or FC < 0.67, p < 0.05. During actual selection, the criteria can be relaxed or tightened, typically controlling within 20% of detected results, with 5-10% being optimal.
What validation methods should be used after proteomics?
The conventional protein validation methods include WB (Western Blot), ELISA, and PRM. If the number of proteins of interest is small and corresponding commercial test kits or antibodies are available, ELISA or WB is recommended for validation as these methods are more mature. If many proteins are of interest and commercial antibodies are unavailable, PRM is recommended. If the budget allows, antibody preparation is also a good option.
Why was the protein detected by Western Blot not detected by mass spectrometry or only detected with one peptide?
Western Blot detects target proteins by amplifying the signal many times, making it very sensitive and almost unaffected by the abundance of background proteins in complex samples (except for specificity binding). In mass spectrometry, proteins with higher abundance in the sample are preferentially detected multiple times, while lower-abundance proteins may be masked due to weak peptide signals and thus not detected. Therefore, if the target protein in the sample has low abundance, even if WB can detect it, mass spectrometry may not or may only detect a few peptides.
Why do transcriptomic data show downregulation while proteomics results show upregulation for the same batch of samples?
This is a normal phenomenon, as the relationship between upstream and downstream is not one-to-one. The conventional correlation coefficient between mRNA and proteins is only 0.4 to 0.5. The expression of a protein is controlled by many factors, including transcription factors, enhancers, inhibitors, and DNA and RNA modifications, in addition to the corresponding mRNA.
How can I improve protein yield from low-abundance samples?
For low-abundance samples, you can improve protein yield by:
- Enrichment Methods: Use protein enrichment techniques such as immunoprecipitation or fractionation to concentrate low-abundance proteins.
- Optimized Lysis Buffers: Choose lysis buffers that are effective for your specific sample type and contain protease and phosphatase inhibitors to prevent protein degradation.
- Concentrate Sample: Use techniques like ultrafiltration or lyophilization to concentrate the sample before analysis.
What are common challenges in proteomics data interpretation, and how can they be addressed?
Data Overload: Proteomics generates large datasets, which can be overwhelming. Using specialized bioinformatics tools and software can help manage and analyze the data efficiently.
False Positives/Negatives: Statistical noise or variability can lead to false positives or negatives. Applying stringent statistical criteria and validating key findings with independent methods like WB or ELISA can mitigate this.
Sample Heterogeneity: Biological variability between samples can complicate data interpretation. Ensuring sufficient biological replicates and proper experimental design can reduce the impact of sample heterogeneity.
How do I select the appropriate controls for a proteomics experiment?
- Negative Controls: Use samples that do not have the condition or treatment of interest to identify background noise or non-specific signals.
- Positive Controls: Include known proteins or peptides that should be detected to ensure the system is working correctly.
- Internal Standards: Adding stable isotope-labeled peptides or proteins as internal standards can help with quantitation and normalization across samples.
What factors should be considered when designing a proteomics experiment?
Experimental Objectives: Clearly define what you want to discover (e.g., differential expression, post-translational modifications).
Sample Quality: Ensure that samples are of high quality and consistently prepared.
Replicates: Include adequate biological and technical replicates to ensure robust and reproducible results.
Instrument Selectio oose the appropriate mass spectrometer and technique based on the nature of your samples and research goals.
How can I address issues with protein solubility during sample preparation?
Protein solubility issues can be managed by:
- Choosing Appropriate Buffers: Use lysis buffers containing detergents (e.g., SDS, Triton X-100) or chaotropes (e.g., urea, guanidine hydrochloride) to solubilize proteins.
- Adjusting pH and Salt Concentrations: Modifying the pH or salt concentration in the buffer can improve solubility for specific proteins.
- Sonication or Mechanical Disruption: Applying sonication or mechanical disruption can help break down cellular structures and improve protein extraction.
Learn more about the proteomics FAQ.
Variability in probiotic formulations revealed by proteomics and physico-chemistry approach in relation to the gut permeability.
Razafindralambo, H., Correani, V., Fiorucci, S., & Mattei, B.
Journal: Probiotics and antimicrobial proteins
Year: 2020
Untargeted proteomics and stage-specific Huntington's disease reveal biological pathways, and potential protein biomarkers.
Papanicolaou, E. Z., Christodoulou, C., & Demetriou, C.
Journal: Research Square
Year: 2024
Impaired phagocytosis of photoreceptor outer segments by RPE in CLN3 disease is a consequence of altered sphingolipid metabolism.
KUMAR, L. K., Han, J., Dalvi, S., Foley, N., Subedi, Y., & Singh, R.
Journal: Investigative Ophthalmology & Visual Science
Year: 2024
Quantitative proteomic analysis of cellular responses to a designed amino acid feed in a monoclonal antibody producing Chinese hamster ovary cell line.
Torkashvand, F., Mahboudi, F., Vossoughi, M., Fatemi, E., Basri, S. M. M., Heydari, A., & Vaziri, B.
Journal: Iranian Biomedical Journal
Year: 2018
See more articles published by our clients.