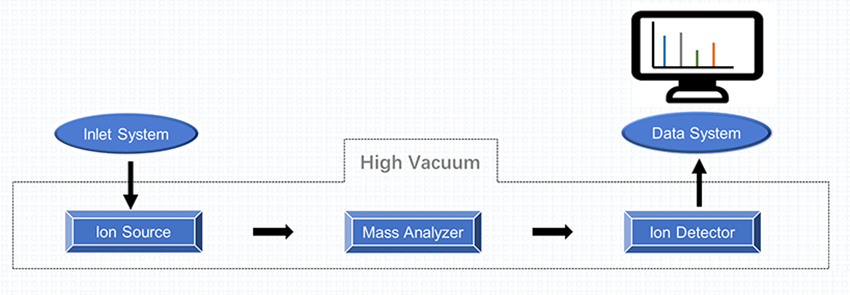
In the past years, mass spectrometry (MS) has undergone a spectacular development in technologies and applications. MS is a technology that generates gas-phase analyte ion, separates and detects these ions according to their mass-to-charge ratio (m/z).
As shown in Figure 1, the mass spectrometer consists of three main components, including ion source, mass analyzer, and detector system. In a mass spectrometry experiment, the process sequence of analysis works in five stages, including sample introduction, analyte ionization, mass analysis, ion detection, and data processing.
 | |||
|
| ||
Figure 1. Components of Mass Spectrometer and Common Types of Each Component
Tandem mass spectrometers (MS/MS) combine different mass analyzers in sequence to increase the versatility and allow multiple experiments. A tandem mass spectrometer can conduct multiple rounds of mass spectrometry, usually separated by some forms of molecule fragmentation. There are various methods for fragmenting molecules for tandem MS.
- Collision-induced dissociation (CID)
- Higher-energy collisional dissociation (HCD)
- Electron-capture dissociation (ECD)
- Electron-transfer dissociation (ETD)
Sample Introduction
Although the sample introduction system is not actually a part of MS, it is important to admit the samples to the ion source while maintaining the high vacuum requirements. Sample introduction may involve individual samples or follow chromatographic separation. Most modern MS is integrated with high performance liquid chromatography (HPLC), which combines the physical separation capabilities of liquid chromatography with the mass analysis capabilities of MS. In addition, for some research (like proteomics), chromatographic separation gives an analysis in advance.
Analyte Ionization
In mass spectrometry, ionization refers to the production of gas-phase ions to enable subsequent mass analysis. Techniques for ionization have been the key to determining what types of samples can be analyzed by mass spectrometry. There are various types of ionization methods used in MS, such as classified based on the physical state of the analyte molecules. The traditional ionization techniques like electron ionization (EI) and chemical ionization (CI) are gas-phase ionization techniques and commonly used in gas chromatography-mass spectrometry (GC–MS). For some other techniques, such as electrospray ionization (ESI) and matrix-assisted laser desorption/ionization (MALDI) as liquid-phase ionization techniques, they are extensively used in liquid chromatography-mass spectrometry (LC-MS).
Mass Analysis
Mass analysis is the heart part of the mass spectrometry. After gas-phase ions have been produced, they are transmitted into the mass analyzer and analyzed according to m/z ratios. There are various types of mass analyzers using static or dynamic fields. Each type of analyzers has its advantages and disadvantages.
There are some important characteristics for measuring the performance of a mass analyzer. The mass range determines the limit of m/z of ion measurement by a mass analyzer. The scan speed means the rate measured by the analyzer in a particular mass range. The mass accuracy refers to the difference between the measured error of the ration of m/z and the true m/z. And the mass resolving is the ability to distinguish two peaks of slightly different m/z.
Ion Detection
After ions pass through the mass analyzer, they are detected and transformed into a usable signal by a detector. Detectors are able to generate an electric current that is proportional to their abundance from the incident ions. Because the number of ions leaving the mass analyzer at a particular instant is generally quite small, the amplification is commonly used to obtain a usable signal. Some detectors are made to count ions of a single mass at a time and therefore they detect the arrival of all ions sequentially at one point. Other types of detectors (like photographic plates or image current detectors) can count multiple masses and detect the arrival of all ions simultaneously along a plane.
Data Processing
The data acquired by mass spectrometer can be used for quantitative analysis, molecular determination, structure elucidation, or sequence determination. Mass spectrometry can produce various types of data. The mass spectrum that is a plot of relative abundance against m/z ratio is the most common data representation. And the interpretation of mass spectra needs the combination of various techniques like a database. Here, we collect some freely accessible databases that may help with your data processing in proteomics and metabolomics.
Table 1. Proteomics and Metabolomics Databases
| Name | URL | Description |
|---|---|---|
| Proteomics Databases | ||
| UniProt | www.uniprot.org | Protein sequence and functional information |
| GELBANK | gelbank.anl.gov | Two-dimensional gel electrophoresis (2DE) gel patterns of proteomes from organisms |
| PDB | www.rcsb.org/pdb | 3D shapes of proteins |
| EBI PRIDE Archive | www.ebi.ac.uk/pride/archive | Proteomics data repository |
| GPMdb | gpmdb.thegpm.org | Global proteome machine database |
| Metabolomics Databases | ||
| Human Metabolome Database (HMDB) | www.hmdb.ca | Detailed information about small molecule metabolites found in the human body |
| Kyoto Encyclopedia of Genes and Genomes (KEGG) | www.kegg.jp | Integrating genomic, chemical and systemic functional information |
| Golm Metabolome Database (GMD) | gmd.mpimp-golm.mpg.de | A gas chromatography (GC) – mass spectrometry (MS) reference library |
| Metlin Metabolomics Database | metlin.scripps.edu/index.php | Metabolite information as well as tandem mass spectrometry data |
| The Small Molecule Pathway Database (SMPDB) | www.smpdb.ca | Containing small-molecule pathways found in humans |


