The integration of multigroup data can study and explain the mechanism of tumor occurrence and development from different angles. This multigroup research method has gradually become the inevitable trend of tumor research. We use the most professional experimental team and the most advanced biomics data processing technology, personalized customized tumor multigroup experimental scheme, confirm each other, enhance the persuasive power of the results; On the other hand, multi-dimensional and omni-directional interpretation of biological processes and mechanisms.
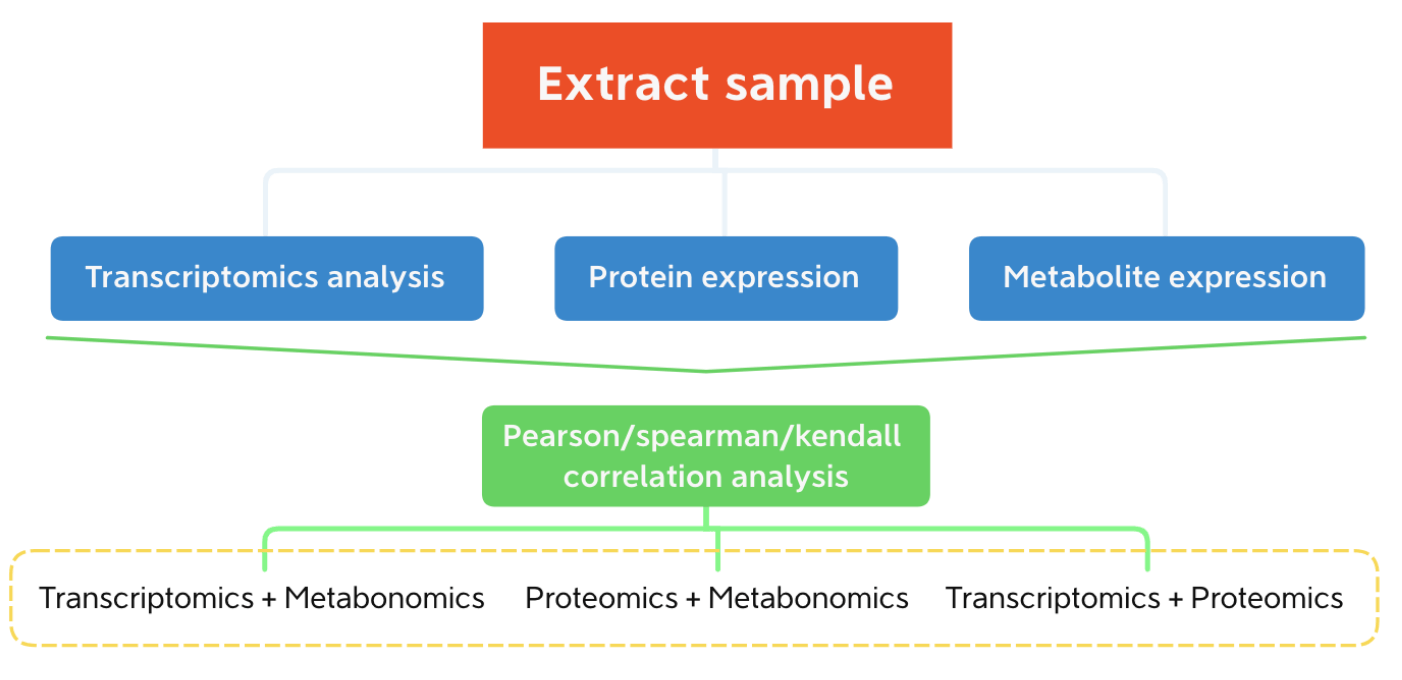
 Figure 1. Flow chart of correlation analysis between Transcriptomics and proteomics
| Histology | Technical | Application |
|---|
| Transcriptomics | Sequencing | Based on Illumina high-throughput sequencing platform, tumor mRNA was directly extracted and sequenced. Combined with bioinformatics analysis, gene function and gene structure were studied at the overall level. |
| Proteomics | Unmarked type | The intra-segment intensity of tumor protein peptide was obtained by mass spectrometry, and the quantitative analysis was carried out. |
| Chemical labeling type | The protein peptides in each tumor sample were efficiently labeled by labeling, and the intensity value was determined by mass spectrometry, which represented the relative expression of proteins in different samples. |
| Biomarker type | The essential amino acids labeled by different stable isotopes were used as labeling reagents to replace the corresponding amino acids in the cell culture medium to label the tumor cells at the biological level. Then the intensity of the protein peptide segments with different markers were quantified by mass spectrometry. |
| New scanning | By using the mode of independent collection of data, the whole range of mass-core ratio is divided into several windows, and the ions are broken and collected at the same time to obtain the information in the sample. |
| Metabonomics | Non-targeted metabolic group | Large-scale and unbiased detection of tumors was carried out based on liquid chromatography-mass spectrometry (LC-MS), and the peak intensity of metabolites was quantitatively analyzed. The fragments of metabolites were matched with the local standard secondary spectrogram database for material identification. |
Our advantage
Mature and reliable multi-group oncology platform: experienced in the project, participated in major projects, high-level cooperation results published
Based on the analysis of high quality data, the content and method of analysis have been pre-studied and tested, which is really mature and feasible.

Sample requirement:

RNA, DNA :The total amount ≥ 6ug, the concentration ≥ 200ng/ul has no obvious degradation.
Protein:Total amount ≥ 500ug, concentration ≥ 1ug/ul.
Tissue sample:50-100mg
Sampling Kit: we provide our customers with a complete sampling kit, including protein and RNA separation kits, as well as tools for storing samples.
Deliverables: raw sequencing data, pruning and stitching sequences, quality control report results, statistics and bioinformatics reports you specify, visual pictures.
Our data processing:
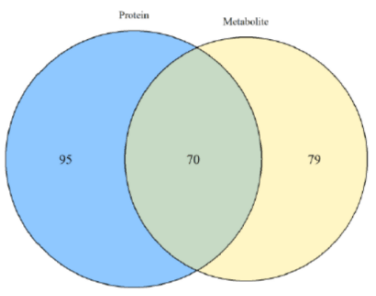
The non-differential metabolites of differential genes were mapped to
KEGG pathway database by pathview to obtain their common
pathway information.
According to the relative content data of mRNA, protein and metabolite, pearson/spearman/kendall and other related algorithms were used to calculate the relationship between gene and protein, protein and metabolite.
According to the data of correlation calculation, the association network is analyzed, and the network diagram is constructed by using Metscape plug-in.
* For Research Use Only. Not for use in the treatment or diagnosis of disease.
Related Services:

 Figure 1. Flow chart of correlation analysis between Transcriptomics and proteomics


