- Service Details
- Demo
- Case Study
- FAQ
- Publications
What is Methylmalonic acid (MMA)?
Methylmalonic acid (MMA) is a dicarboxylic acid that is a C-methylated derivative of malonate. The coenzyme A linked form of methylmalonic acid, methylmalonyl-CoA, is converted into succinyl-CoA by methylmalonyl-CoA mutase, in a reaction that requires vitamin B12 as a cofactor. In this way, it enters the Krebs cycle, and is thus part of one of the anaplerotic reactions.
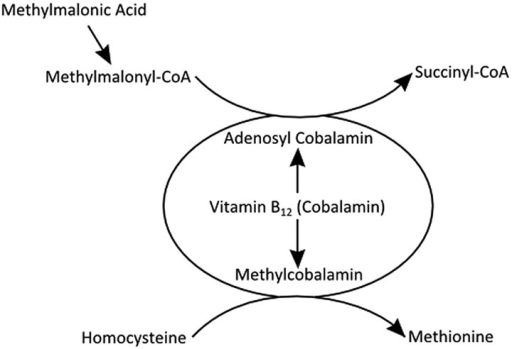 Figure 1. The methylmalonic acid metabolism.
Elevated levels of methylmalonic acid (MMA) result from inherited defects of enzymes involved in MMA metabolism or inherited or acquired deficiencies of vitamin B12 (cobalamin) or its downstream metabolites. Acquired nutritional deficiencies are much more common than inherited defects and can be due to intestinal malabsorption, impaired digestion, or poor diet. Elderly patients with cobalamin deficiency may present with peripheral neuropathy, ataxia, and loss of position and vibration senses, memory impairment, depression, and dementia in the absence of anemia. Other conditions such as renal insufficiency, hypovolemia, and bacterial overgrowth of the small intestine also contribute to the possible causes of mild methylmalonic acidemia and aciduria.
MMA is also a specific diagnostic marker for the group of disorders collectively called methylmalonic acidemia, which include at least 7 different complementation groups. Two of them (mut0 and mut-) reflect deficiencies of the apoenzyme portion of the enzyme methylmalonyl-CoA mutase. Two other disorders (CblA and CblB) are associated with abnormalities of the adenosylcobalamin synthesis pathway. CblC, CblD, and CblF deficiencies lead to impaired synthesis of both adenosyl- and methylcobalamin.
MMA concentrations in blood are measured by gas chromatographic mass spectrometry or LC-MS and the expected values of MMA in healthy people are between 73–271 nmol/L. Currently, a reliable and reproducible method using highly sensitive LC-MS platform for the rapid identification and quantification of MMA in different sample types has been established by the experienced scientists at Creative Proteomics, which can satisfy the needs of academic and industrial study in your lab.
Methylmalonic Acid Analysis in Creative Proteomics
Methylmalonic Acid Quantification: Accurate measurement of MMA levels in various biological samples using state-of-the-art mass spectrometry techniques.
Methylmalonic Acid Metabolite Profiling: Comprehensive profiling of MMA and related metabolites to provide insights into metabolic pathways and disorders.
Biomarker Discovery: Identification and validation of MMA as a biomarker for specific diseases, such as vitamin B12 deficiency and certain metabolic disorders.
Method Development and Validation: Custom development and validation of MMA analysis methods to meet the specific requirements of your research projects.
Data Interpretation and Reporting: Comprehensive data analysis and interpretation services, providing you with detailed reports and expert insights.
Analytical Techniques for Methylmalonic Acid Analysis
Gas Chromatography-Mass Spectrometry (GC-MS)
GC-MS is a highly sensitive and specific technique for analyzing MMA. This method involves the derivatization of MMA to improve its volatility, followed by separation using gas chromatography and detection via mass spectrometry. We use advanced GC-MS systems, such as the Agilent 7890B GC coupled with the Agilent 5977B MSD, which provide excellent specificity and sensitivity, making them ideal for detecting low concentrations of MMA in complex biological matrices.
Liquid Chromatography-Tandem Mass Spectrometry (LC-MS/MS)
LC-MS/MS is another robust technique for MMA analysis. This method does not require derivatization, simplifying sample preparation. LC-MS/MS combines the separation capabilities of liquid chromatography with the high sensitivity and specificity of tandem mass spectrometry. We utilize top-of-the-line LC-MS/MS systems, such as the Thermo Fisher Scientific TSQ Altis Triple Quadrupole MS and the Waters Xevo TQ-S micro, which are particularly advantageous for quantifying MMA in plasma and urine samples with high precision.
Enzyme-Linked Immunosorbent Assay (ELISA)
ELISA is a widely used immunoassay technique for detecting MMA. It is based on the principle of antigen-antibody interaction, providing a cost-effective and relatively simple method for MMA quantification. We use high-quality ELISA kits from reputable manufacturers like R&D Systems and Thermo Fisher Scientific, which, while less sensitive than GC-MS or LC-MS/MS, are suitable for high-throughput screening of MMA in large sample cohorts.
Sample Requirements for Methylmalonic Acid Analysis
| Sample Type | Recommended Volume | Notes |
|---|---|---|
| Plasma | 0.5 mL | Collect in EDTA or heparin tubes. Avoid hemolysis during collection. |
| Serum | 0.5 mL | Use plain tubes without anticoagulants. Allow to clot before spinning. |
| Urine | 10 mL | Collect midstream urine. Avoid contamination. |
| Dried Blood Spots | 3-5 spots (6 mm) | Collect on filter paper and air-dry completely before shipping. |
Important Considerations:
- Sample Collection: Ensure proper sample collection to avoid hemolysis or contamination, which can interfere with MMA measurement.
- Storage and Transport: Store samples at -80°C if not analyzed immediately. Use dry ice for transport to maintain sample integrity.
- Labeling: Clearly label all samples with unique identifiers to avoid mix-ups during processing.
Report
- A detailed technical report will be provided at the end of the whole project, including the experiment procedure, instrument parameters.
- Analytes are reported as uM or ug/mg (tissue), and CV's are generally<10%.
- The name of the analytes, abbreviation, formula, molecular weight and CAS# would also be included in the report.

PCA chart

PLS-DA point cloud diagram

Plot of multiplicative change volcanoes

Metabolite variation box plot

Pearson correlation heat map
Mass spectrometry analysis of urinary methylmalonic acid to screen for metabolic vitamin B12 deficiency in older adults.
Journal: Bioanalysis
Published: 2020
Background
Vitamin B12 deficiency, affecting 5-15% of older adults, is primarily caused by food-vitamin B12 malabsorption and can lead to severe neurological issues. Early diagnosis is critical since symptoms can become irreversible if untreated. Traditional diagnosis using total serum vitamin B12 levels is often unreliable, leading to the need for more specific and practical markers. Elevated serum methylmalonic acid (sMMA) is a more accurate marker of vitamin B12 deficiency, but its measurement via gas chromatography/mass spectrometry (GC-MS) is costly and not widely accessible. Furthermore, sMMA levels can be affected by kidney function, complicating its use in older populations.
Urinary MMA (uMMA) presents a promising alternative. uMMA levels, adjusted for urinary creatinine, are not influenced by kidney function. Current methods primarily use GC-MS, involving complex derivatization steps. Recent advancements include a reverse-phase ultra-performance liquid chromatography coupled to tandem mass spectrometry (UPLC-MS/MS) method for analyzing uMMA and creatinine without derivatization, offering a simpler, cost-effective, and non-invasive solution for screening and diagnosing vitamin B12 deficiency in older populations.
Materials & Methods
Reagents
Anhydrous creatinine (≥98%), MMA (99%), EDTA disodium salt dihydrate (99.0-101.0%), BTH (≥99.0%), Formic acid (>99%), methanol (HPLC grade), water (Optima LC/MS grade), ethyl acetate, diethyl ether, sodium chloride (BioReagent grade), 5 N Hydrochloric acid, anhydrous ethanol, RegisilR reagent (BSTFA + 10% trimethylchlorosilane).
Quality Controls & Calibration Curves
Low (L), Medium (M), High (H) quality controls (QCs) in water for MMA (3, 75, 250 μmol/l) and creatinine (2, 12, 26 mmol/l). Calibration curve solutions included varying concentrations of MMA and creatinine.
Urine Sample Preparation for UPLC−MS/MS Analysis
Internal standards (MMA-D3 and creatinine-D3) added to urine samples in a 96-well plate. Centrifugation and sealing followed by QC and calibration point preparations.
Targeted Metabolomics Analysis
- UPLC−MS/MS Analysis of MMA & Creatinine in Urine Samples: Acquity I-Class UPLC system coupled to Xevo TQ-S micro mass spectrometer. MS transitions for MMA, creatinine, and internal standards in Tables 2 and 3.
- GC–MS Analysis of MMA in Urine & Serum Samples: MMA derivatization with BSTFA, followed by extraction and analysis using Agilent 6890A GC with 5973 inert mass selective detector.
Statistical Analyses
Validation against GC–MS and serum markers using Spearman correlations, Wilcoxon signed rank tests, Bland-Altman analysis. Multivariable regression modeling of uMMA/creatinine ratio with demographic and clinical variables using IBM SPSS Statistics, version 25.
Results
UPLC–MS/MS of MMA & Creatinine in Urine Samples
The UPLC–MS/MS method enabled simultaneous quantification of MMA and creatinine in urine samples, essential for normalizing biomarker concentrations. A rapid chromatographic run of 2.3 minutes effectively separated MMA from succinic acid, a potential interference in urine samples. Figure 1 illustrates representative ion chromatograms obtained for MMA, creatinine, and their internal standards in urine from a healthy control.
 Ion Chromatograms of MMA and Creatinine in Urine. Ion chromatograms showing peaks for MMA, creatinine, and their respective internal standards in urine from a healthy control.
Method Validation
The UPLC–MS/MS method was rigorously validated (details in Supplementary Information File 1) with high accuracy and precision. Intra- and interday accuracy biases were ≤6.3%, and precision coefficients of variation were ≤6.0% for both MMA and creatinine. Stability tests demonstrated minimal biases under various storage and handling conditions. Limits of detection (LODs) and quantification (LOQs) were determined as 0.34 and 1.15 μmol/l for MMA, and 0.0010 and 0.0034 mmol/l for creatinine, respectively.
Comparison with GC–MS Method
Comparison of uMMA/creatinine ratios between UPLC–MS/MS and GC–MS methods in 34 participants revealed a strong correlation (Spearman's rho, 0.99; p < 0.0001), with UPLC–MS/MS slightly underestimating values (mean difference -9.5%). Bland-Altman analysis indicated no proportional bias across the range of uMMA/creatinine ratios examined, supporting the method's reliability.
 Bland-Altman Plot of UPLC–MS/MS vs GC–MS Methods. Bland-Altman plot illustrating the agreement between uMMA/creatinine ratios measured by UPLC–MS/MS and GC–MS methods.
Associations with Serum Markers of Vitamin B12 Status
Analysis revealed positive correlations between uMMA/creatinine ratios and serum MMA concentrations (Spearman's rho, 0.65; p < 0.001), and negative correlations with serum vitamin B12 levels (Spearman's rho, -0.39; p = 0.02). Scatterplots demonstrated a linear relationship between log-transformed uMMA/creatinine ratios and serum MMA, and a segmented correlation with serum vitamin B12, suggesting a breakpoint indicative of vitamin B12 deficiency.
 A: Scatterplot of uMMA/Creatinine Ratio vs Serum MMA. B: Scatterplot of uMMA/Creatinine Ratio vs Serum Vitamin B12
Scatterplot depicting the correlation between log-transformed uMMA/creatinine ratios and serum MMA concentrations. Scatterplot showing the relationship between uMMA/creatinine ratios and serum vitamin B12 levels.
Determinants of uMMA/Creatinine Ratio
Multivariable regression analysis identified sex and estimated glomerular filtration rate (eGFR) as significant determinants of uMMA/creatinine ratios. Women exhibited higher ratios, while higher eGFR correlated with elevated ratios, after adjusting for vitamin B12 status. Other demographic factors did not significantly influence the ratio.
Reference
- Boutin, Michel, et al. "Mass spectrometry analysis of urinary methylmalonic acid to screen for metabolic vitamin B12 deficiency in older adults." Bioanalysis 12.10 (2020): 693-705.
What level of MMA indicates B12 deficiency?
Methylmalonic acid (MMA) levels are considered elevated when they exceed normal reference ranges established by clinical laboratories. The threshold for indicating vitamin B12 deficiency can vary slightly between different studies and clinical practices, but generally:
- In urine: MMA levels above 4.0 μmol/mmol of creatinine are often considered elevated and suggestive of vitamin B12 deficiency. This ratio accounts for the variation in urine concentration due to hydration status.
- In serum: MMA levels above 0.28 μmol/L are typically considered elevated. Serum MMA levels are less commonly used than urine MMA due to variations in laboratory techniques and interpretation.
It's important to note that these thresholds may vary slightly depending on the laboratory and the specific assay method used.
Are there alternative biomarkers to methylmalonic acid for assessing vitamin B12 status?
Yes, besides methylmalonic acid (MMA), there are several other biomarkers used to assess vitamin B12 status:
- Serum Vitamin B12: This measures the total amount of vitamin B12 in the blood. Low serum B12 levels (<148 pmol/L) are indicative of deficiency. However, serum B12 levels can be influenced by factors other than deficiency, such as genetics and certain medications.
- Holotranscobalamin (holoTC): Also known as active B12, holoTC represents the biologically active fraction of vitamin B12 that is bound to transcobalamin. It is considered a more specific marker for tissue B12 deficiency compared to total serum B12.
- Total Homocysteine: Elevated levels of homocysteine in the blood can indicate vitamin B12 deficiency, as B12 is necessary for the conversion of homocysteine to methionine. However, elevated homocysteine can also result from deficiencies in folate and vitamin B6.
- Methylmalonic Aciduria (MMA): In cases of severe vitamin B12 deficiency or certain metabolic disorders, MMA can accumulate to extremely high levels in the blood and urine. This is usually associated with genetic disorders rather than simple dietary deficiency.
Each biomarker has its strengths and limitations. MMA is particularly sensitive and specific for functional vitamin B12 deficiency, reflecting impaired enzymatic processes due to insufficient vitamin B12. Combining several biomarkers, such as MMA with serum B12 and holoTC, can provide a comprehensive assessment of vitamin B12 status and aid in accurate diagnosis and management of deficiency-related conditions.
Cancer SLC43A2 alters T cell methionine metabolism and histone methylation.
Bian, Y., Li, W., Kremer, D. M., Sajjakulnukit, P., Li, S., Crespo, J., ... & Zou, W.
Journal: Nature
Year:2020
https://doi.org/10.1038/s41586-020-2682-1
Metabolomic profiling implicates mitochondrial and immune dysfunction in disease syndromes of the critically endangered black rhinoceros (Diceros bicornis)
Corder, M. L., Petricoin, E. F., Li, Y., Cleland, T. P., DeCandia, A. L., Alonso Aguirre, A., & Pukazhenthi, B. S.
Journal: Scientific Reports
Year: 2023
https://doi.org/10.1038/s41598-023-41508-4
Transcriptomics, metabolomics and lipidomics of chronically injured alveolar epithelial cells reveals similar features of IPF lung epithelium
Willy Roque, Karina Cuevas-Mora, Dominic Sales, Wei Vivian Li, Ivan O. Rosas, Freddy Romero
Journal: bioRxiv
Year: 2020
https://doi.org/10.1101/2020.05.08.084459