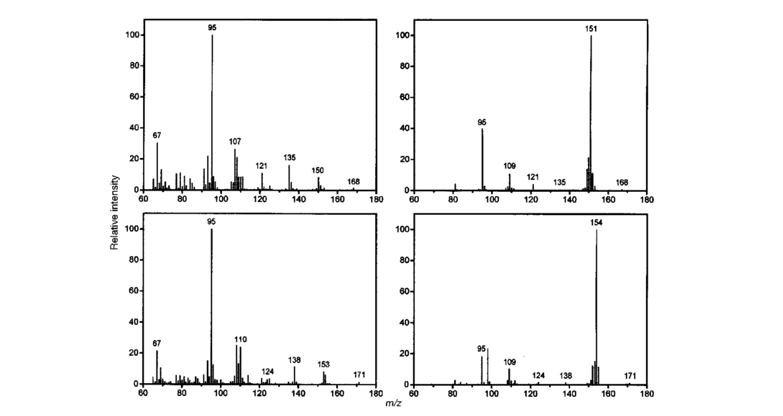
Electron ionization (EI) is an ionization method that is mature and most prevalently used to determine the structure of unknown compounds. Once the mass spectrum of a sample is obtained, how do we interpret the data to results we can recognize?
1. Identification of molecular ion peaks
1) Must be the ion peak of the highest mass.
2) Must be an ion peak with an odd charge.
3) Reasonable fragments can be lost, and ion peaks with reasonable mass numbers appear, such as M-1, M-15, M-18, M-28, M-44, etc. Peaks with 4-13 and 21-25 mass differences are unlikely to appear.
4) The mass number must conform to the nitrogen rule.
In common organic compound molecules, only nitrogen atoms have odd bond valence and even mass number. A coincidental rule is that the number of nitrogen atoms in all molecules is related to the number of even or odd mass numbers of molecular ions, known as the "nitrogen rule" in mass spectrometry.
The mass number of the mass spectrum fragments containing nitrogen atoms or even nitrogen atoms must be odd. The mass fraction of a mass spectrum containing an odd number of nitrogen atoms must have an even number.
5) Identification and application of isotope peaks.
Among common elements in organic compounds, H1, F19, P31, I127 have no natural isotopes. The number of O16 and N14 in molecules is generally small, and their natural isotope abundance is much less than 1% (O18 0.2%, N15 0.37%), so the effect is small and negligible. The abundance of C13, an isotope of C12 atoms commonly found in molecules, is 1.1% in nature. When the number of carbon atoms in a molecule is large, the abundance of C13 can give useful information. In addition, other common natural isotopes include: natural isotopes of silicon (Si28 100%, Si29 5.1%, Si30 3.4%), natural isotopes of sulfur (S32 100%, S34 4.4%), isotopes of chlorine (Cl35 100%, cl37 32.5%), and isotopes of bromine (Br79 100%, Br81 98%). When there are multiple chlorine and bromine atoms, a series of strength peaks such as A + 2, A + 4, A + 6 can appear.
6) Auxiliary soft ionization technology: such as FAB, ESI, etc. Soft ionization techniques usually give cluster ion peaks such as M + 1, M + 18 (H2O), M + 70 (substrate glycerol), which are very useful for identifying molecular ion peaks.
2. Analytic fragment ion peaks
It is difficult to try to explain the full spectrum of mass spectral fragmentation peaks because some ions produced by ion reactions occur in the ionization sources of mass spectra. Therefore, we only need to correctly identify and explain the strong peaks and some structural features of the spectrum.
1) Find rearranged peaks of structural features
2) Calculate the mass difference between peaks, find reasonable mass-related fragments, and get important structural information. Identify common peaks that lose reasonably neutral debris. For example, groups containing hydroxyl (-OH) are prone to M-18 peaks. Groups containing carbonyl (C = O) are prone to M-28 peaks. Compounds containing carboxyl (-COOH) groups and epoxy groups tend to have M-44 peaks.
3. General process of inferring molecular structure
(1) Molecular ion peaks are determined by the high mass end of mass spectrometry.
(2) Derive the chemical formula of the compound based on the high-resolution data of molecular ion peaks.
(3) Calculate the degree of unsaturation of a compound from the chemical formula, that is, determine the number of rings and double bonds in the compound.
(4) Study of high-mass terminal ion peaks. The high-mass terminal ion peak of mass spectrum is caused by the loss of molecular ion fragments. From molecular ion loss fragments, it is possible to determine which substituents are contained in the compound.
(5) Study the low-mass end ion peaks to find the characteristic ions and ion series generated after the cleavage of different compounds. For example, the m/z of the characteristic ion series of n-alkanes is 15, 29, 43, 57, 71.
(6) Through the above research, the structure unit of the compound is proposed. According to the molecular weight, molecular formula, sample origin, physical and chemical properties of the compound, one or more possible structures are proposed.
(7) Verify the results. Methods of verification include:
A. Decompose the obtained structural formula according to the fragmentation rule of mass spectrometry, and check whether the spectrum of the obtained ion and the given unknown are consistent;
B. Check whether the standard mass spectrum of the compound is the same as the unknown spectrum;
C. Find the standard sample and get the mass spectrum of the standard sample, and then compare it with the spectrum of the unknown.
Figure from McCallum et al, 1998
References:
1. Nicolescu T O. Interpretation of Mass Spectra. Mass Spectrometry, 2017: 23.
2. WANG Jing-Zun. How to Interpret EI-MS Spectra. University Chemistry, 2016, 31(4): 49-54 doi:10.3866/PKU.DXHX20160449.
